Multiple Choice
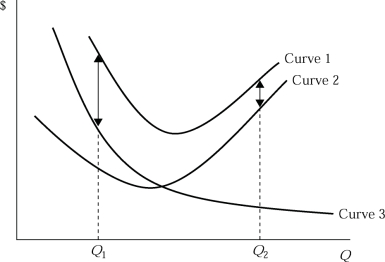 Figure 5.1
-Refer to Figure 5.1, which shows a family of average cost curves. The average total cost curve is represented by:
A) Curve 1.
B) Curve 2.
C) Curve 3.
D) The vertical sum of curve 1 and curve 2.
Correct Answer:
Verified
Related Questions
Q41: Marginal product in the short run
A) increases
Q44: Q48: Q49: Q49: Q50: _ is a cost that independent of Q54: Q57: Average variable cost equals Q65: Mark's Baseballs produces baseballs. Mark's Baseballs has Q70: Unlock this Answer For Free Now! View this answer and more for free by performing one of the following actions Scan the QR code to install the App and get 2 free unlocks Unlock quizzes for free by uploading documents![]()
![]()
![]()
![]()
![]()
A) total fixed cost![]()

