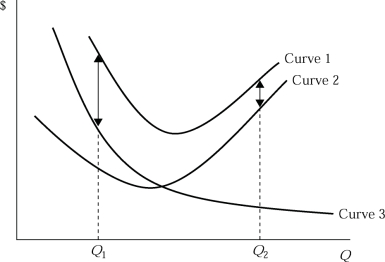
Solved

Figure 5.1 -Refer to Figure 5.1, Which Shows a Family of Average

Question 66

Multiple Choice

  Figure 5.1 -Refer to Figure 5.1, which shows a family of average cost curves. Why does the vertical distance between Curve 1 and Curve 2 decrease as output increases from Q1 to Q2? A) Because average variable cost first decreases, then increases as output increases from Q1 to Q2. B) Because average fixed cost decreases as output increases from Q1 to Q2. C) Because average total cost first decreases, then increases as output increases from Q1 to Q2. D) Because average variable cost increases faster than average fixed cost as output level approaches Q2. Figure 5.1
-Refer to Figure 5.1, which shows a family of average cost curves. Why does the vertical distance between Curve 1 and Curve 2 decrease as output increases from Q1 to Q2?


A) Because average variable cost first decreases, then increases as output increases from Q1 to Q2.
B) Because average fixed cost decreases as output increases from Q1 to Q2.
C) Because average total cost first decreases, then increases as output increases from Q1 to Q2.
D) Because average variable cost increases faster than average fixed cost as output level approaches Q2.

Correct Answer:

verifed

Verified

Unlock this answer now
Get Access to more Verified Answers free of charge

Related Questions

Unlock this Answer For Free Now!

View this answer and more for free by performing one of the following actions

qr-code

Scan the QR code to install the App and get 2 free unlocks

upload documents

Unlock quizzes for free by uploading documents