Table 6 -1. Actual Sales Data
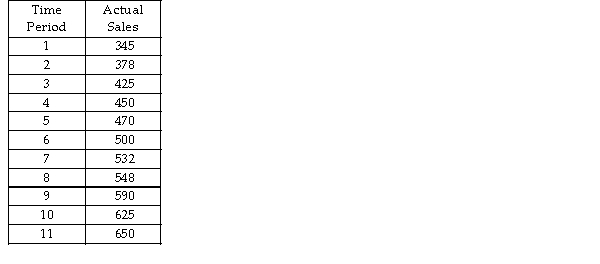
-Refer to Table 6 -1. Using a weighted moving average with weights of 0.1, 0.3, and 0.6, the forecast sales for periods 4 and 5 are approximately
A) 363 and 399.
B) 383 and 418.
C) 403 and 435.
D) 418 and 448.
E) 435 and 460.
Correct Answer:
Verified
Q19: The difference between an actual figure and
Q20: An increase in sales on the income
Q21: The forecasting model that is not a
Q22: The forecasting model that uses a panel
Q23: Table 6 -1. Actual Sales Data
Q25: Table 6 -1. Actual Sales Data
Q26: The forecasting model that uses the constant
Q27: The forecasting model that assumes previous time
Q28: The formula for a regression line is
Q29: The formula for a regression line is
Unlock this Answer For Free Now!
View this answer and more for free by performing one of the following actions

Scan the QR code to install the App and get 2 free unlocks

Unlock quizzes for free by uploading documents