Figure 5.7 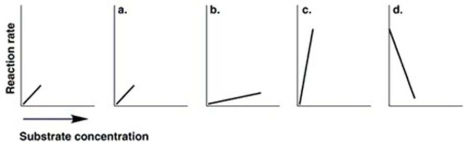 The graph at the left in Figure 5.7 shows the reaction rate for an enzyme at its optimum temperature. Which graph shows enzyme activity at a higher temperature?
A) a
B) b
C) c
D) d
Correct Answer:
Verified
Q19: A strictly fermentative bacterium produces energy
A) only
Q21: Which of the following statements regarding the
Q22: If a cell is starved for ATP,
Q25: Which of the following statements are TRUE?
Q27: In green and purple bacteria, electrons to
Q28: Which of the following uses CO₂ for
Q29: Assume you are working for a chemical
Q30: Which of the following is TRUE about
Q34: Figure 5.8 Q37: Which of the following statements regarding metabolism
![]()
Unlock this Answer For Free Now!
View this answer and more for free by performing one of the following actions

Scan the QR code to install the App and get 2 free unlocks

Unlock quizzes for free by uploading documents