Figure 14.3 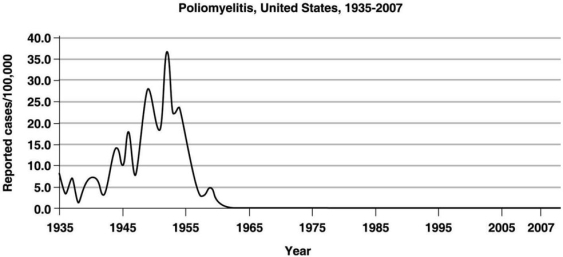 The graph in Figure 14.3 shows the incidence of polio in the United States. The period between 1945 and 1955 indicates a(n)
A) epidemic level.
B) communicable disease.
C) sporadic infection.
D) endemic level.
E) pandemic.
Correct Answer:
Verified
Q21: Figure 14.2 Q22: Figure 14.1 Q23: Which of the following can contribute to Q28: A researcher has performed a prospective study Q33: Which of the following is NOT an Q35: A disease in which the causative agent Q36: In which of the following diseases can Q37: Symptoms of disease differ from signs of Q38: A cold transmitted by a facial tissue Q49: Which one of the following is NOT![]()
![]()
Unlock this Answer For Free Now!
View this answer and more for free by performing one of the following actions

Scan the QR code to install the App and get 2 free unlocks

Unlock quizzes for free by uploading documents