Short Answer
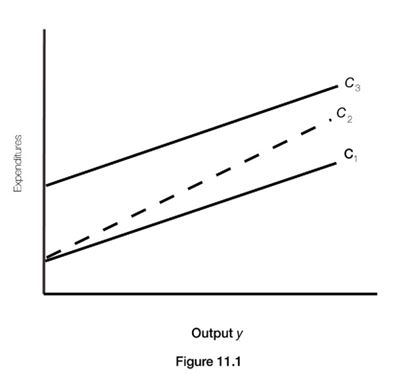
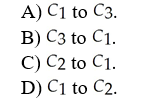
-In Figure 11.1, an increase in the marginal propensity to consume is represented by a change in the consumption function from
Correct Answer:
Verified
Related Questions
Q38: At a fixed income level, an increase
Q39: Let "C = Ca+ by" define the
Q40: Let "C =Ca + by" define the
Q41: Recall the Application about the impact that
Q42: Recall the Application about the impact that
Q44: Recall the Application about the impact that
Unlock this Answer For Free Now!
View this answer and more for free by performing one of the following actions

Scan the QR code to install the App and get 2 free unlocks

Unlock quizzes for free by uploading documents