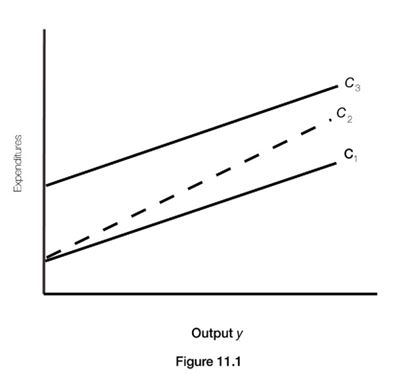
-In Figure 11.1, a decrease in the marginal propensity to save is represented by a change in the consumption function from
A) 
B) 
C) 
D) 
Correct Answer:
Verified
Q42: Recall the Application about the impact that
Q43: Q44: Recall the Application about the impact that Q45: Q46: Which of the following causes the consumption Q48: The marginal propensity to consume (MPC)is the Q49: The consumption function shows the relationship between Q50: Autonomous consumption is consumer spending which is Q51: Increases in consumer wealth will cause an Q52: The slope of the consumption function is![]()
![]()
Unlock this Answer For Free Now!
View this answer and more for free by performing one of the following actions

Scan the QR code to install the App and get 2 free unlocks

Unlock quizzes for free by uploading documents