Figure 11.3
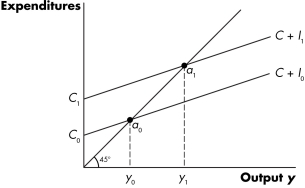
-In Figure 11.3, the change in investment spending is represented as the distance between points
A) C0 and C1.
B) y0 and y1.
C) a0 and a1.
D) a1 and y1.
Correct Answer:
Verified
Q86: Figure 11.3 Q87: Let C = 80 + 0.6y and Q88: In the simple economy where y = Q89: Recall the Application about the difficulty in Q90: If a policymaker wants to stimulate the Q92: Suppose that C =Ca + 0.6y and Q93: The value of the multiplier _ as Q94: As the marginal propensity to consume _, Q95: The multiplier increases as the MPC increases. Q96: Let C = 300 + 0.9y and
![]()
Unlock this Answer For Free Now!
View this answer and more for free by performing one of the following actions

Scan the QR code to install the App and get 2 free unlocks

Unlock quizzes for free by uploading documents