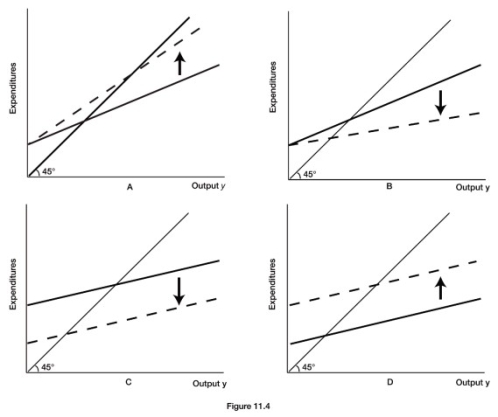
-Refer to Figure 11.4. Which diagram illustrates the effect of an increase in the income tax rate?
A) A
B) B
C) C
D) D
Correct Answer:
Verified
Q113: Assume that GDP = $10,000 and the
Q114: If the marginal propensity to consume is
Q115: If the MPC = 0.75, the government
Q116: The tax multiplier is negative because
A) increases
Q117: Raising the personal income tax rate rotates
Q119: The multiplier that arises from equal increases
Q120: An increase in the income tax rate
Q121: Consumers will spend a higher proportion of
Q122: Higher tax rates lower the value of
Q123: If the economy has an MPC of
Unlock this Answer For Free Now!
View this answer and more for free by performing one of the following actions

Scan the QR code to install the App and get 2 free unlocks

Unlock quizzes for free by uploading documents