Multiple Choice
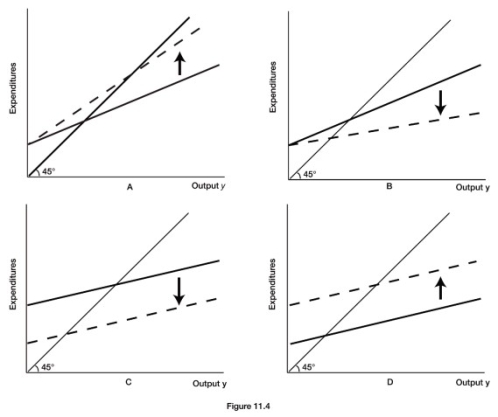
-Refer to Figure 11.4. Which diagram illustrates the effect of a decrease in the marginal propensity to consume?
A) A
B) B
C) C
D) D
Correct Answer:
Verified
Related Questions
Q128: Raising the tax rate lowers the tax-adjusted
Q129: How do automatic stabilizers work to mitigate
Q130: What would happen to an economy if
Q131: Q132: Suppose policy makers want to increase GDP Q134: Why is the tax multiplier smaller (in Unlock this Answer For Free Now! View this answer and more for free by performing one of the following actions Scan the QR code to install the App and get 2 free unlocks Unlock quizzes for free by uploading documents![]()

