Multiple Choice
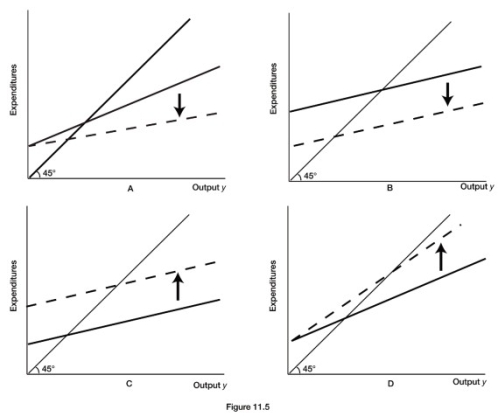
-Refer to Figure 11.5. An increase in the marginal propensity to import is best illustrated by diagram
A) A.
B) B.
C) C.
D) D.
Correct Answer:
Verified
Related Questions
Q142: Recall the Application about the U.S. "Locomotive
Q143: The fraction of additional income spent on
Q144: Suppose the overall MPC is 0.75 and
Q145: Q146: Suppose the United States is in the Q148: The fraction of additional income spent on Q149: Define the marginal propensity to import.![]()
Unlock this Answer For Free Now!
View this answer and more for free by performing one of the following actions

Scan the QR code to install the App and get 2 free unlocks

Unlock quizzes for free by uploading documents