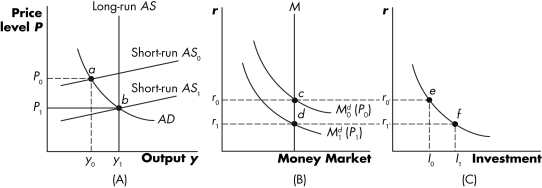
Figure 15.3

-Refer to Figure 15.3 and explain what happens in each graph when an economy is moving from a recession (point a)back to full employment.
Correct Answer:
Verified
View Answer
Unlock this answer now
Get Access to more Verified Answers free of charge
Q137: In the short run, increases in the
Q138: "Crowding in" refers to
A) an increase of
Q139: Money demand increases as the price level
Q140: Recall the Application about the possibility of
Q141: Classical economics is often associated with Say's
Q143: Explain why the flexibility of wages and
Unlock this Answer For Free Now!
View this answer and more for free by performing one of the following actions

Scan the QR code to install the App and get 2 free unlocks

Unlock quizzes for free by uploading documents