Multiple Choice
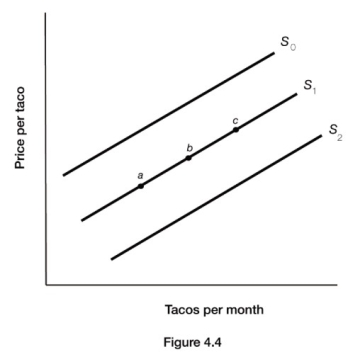
-Figure 4.4 illustrates the supply of tacos. A decrease in the supply of tacos is represented by a movement from
A) point a to point b.
B) point c to point b.
C) S2 to S1.
D) S0to S1.
Correct Answer:
Verified
Related Questions
Q103: An increase in supply of a product
Q104: If a technological advance makes it possible
Q105: Describe the changes in the variables that
Q106: The price of pineapples has risen dramatically.
Unlock this Answer For Free Now!
View this answer and more for free by performing one of the following actions

Scan the QR code to install the App and get 2 free unlocks

Unlock quizzes for free by uploading documents