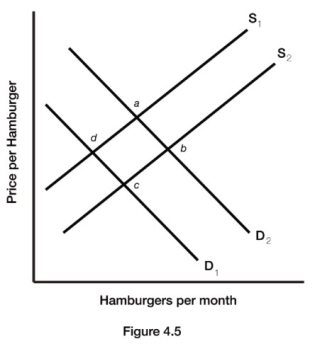
-Figure 4.5 illustrates a set of supply and demand curves for hamburgers. An increase in supply and an increase in quantity demanded are represented by a movement from
A) point a to point b.
B) point a to point c.
C) point d to point b.
D) point c to point d.
Correct Answer:
Verified
Q135: Q136: If the demand for jelly increases, and Q137: Q138: Suppose that in 2011, 3 million plasma Q140: Corn is used to produce tortillas. If Q141: An increase in wages will shift the Q142: Explain what will happen to the equilibrium Q143: Describe the changes in the variables that Q144: Recall the Application about the decline in Q209: Suppose that a new advertising campaign extolling![]()
![]()
Unlock this Answer For Free Now!
View this answer and more for free by performing one of the following actions

Scan the QR code to install the App and get 2 free unlocks

Unlock quizzes for free by uploading documents