Multiple Choice
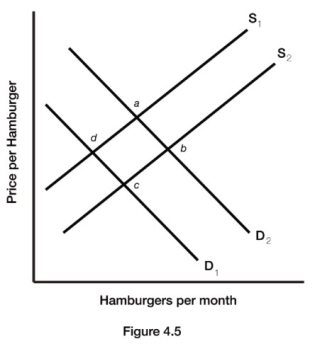
-Figure 4.5 illustrates a set of supply and demand curves for hamburgers. A decrease in demand and a decrease in quantity supplied are represented by a movement from
A) point c to point a.
B) point a to point c.
C) point b to point c.
D) point d to point b.
Correct Answer:
Verified
Related Questions
Q125: If the demand for jelly decreases, and
Q126: Q128: Bananas and apples are substitutes. When the Q129: Suppose that a technological advancement substantially reduces Unlock this Answer For Free Now! View this answer and more for free by performing one of the following actions Scan the QR code to install the App and get 2 free unlocks Unlock quizzes for free by uploading documents![]()

