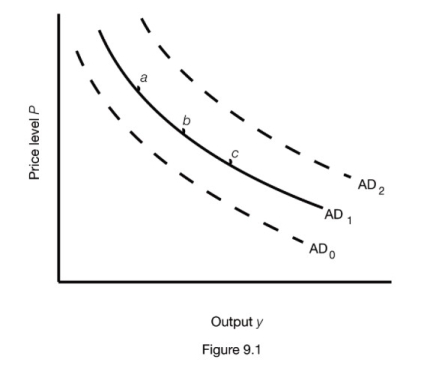
-Figure 9.1 shows three aggregate demand curves. A movement from curve AD1 to curve AD0 could be caused by a(n)
A) increase in the money supply.
B) decrease in taxes.
C) increase in the price level.
D) decrease in government spending.
Correct Answer:
Verified
Q53: Which of the following does NOT shift
Q54: The purchasing power of money increases as
Q55: When the price level is low, resulting
Q56: Figure 9.1 shows three aggregate demand curves.
Q57: Figure 9.1 shows three aggregate demand curves.
Q59: Which of the following would cause a
Q60: The real value of money _ as
Q61: If the government decreases its purchases of
Q62: The marginal propensity to save (MPS)is the
A)
Q63: Figure 9.1 shows three aggregate demand curves.
Unlock this Answer For Free Now!
View this answer and more for free by performing one of the following actions

Scan the QR code to install the App and get 2 free unlocks

Unlock quizzes for free by uploading documents