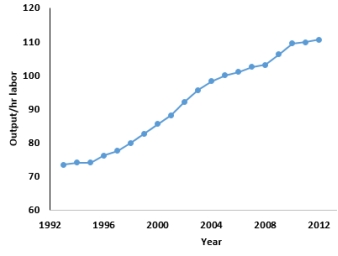
The following scatterplot shows output/hour labor and years.The graphical display is an example of what type of data?
A) Cross-sectional
B) Nominal
C) Categorical
D) Time Series
E) Ordinal
Correct Answer:
Verified
Q61: What scale of measurement is type of
Q62: For the following data, the forecasted monthly
Q63: Which statement about influential points is true?
A)Removal
Q64: The regression equation to predict the job
Q65: The U.S.Bureau of Labor Statistics (BLS) compiles
Q67: According to the residual plot for a
Q68: A consumer research group investigating the relationship
Q69: A recent survey of online shoppers asked
Q70: According to the multiple regression model to
Q71: Based on the actual and forecasted returns
Unlock this Answer For Free Now!
View this answer and more for free by performing one of the following actions

Scan the QR code to install the App and get 2 free unlocks

Unlock quizzes for free by uploading documents