The following scatterplot shows monthly sales figures (in units) and number of months of experience on the job for a sample of 19 salespeople.Describe the association between monthly sales and level of experience.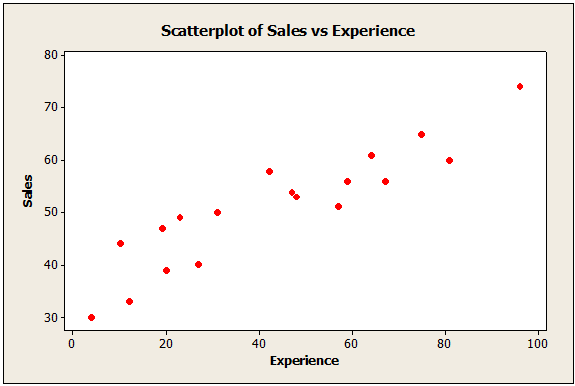
A) Wear negative linear association
B) Moderate positive linear association
C) Moderate negative linear association
D) Weak positive linear association
E) Non-linear
Correct Answer:
Verified
Q84: Boxplots of earnings per share (EPS) data
Q85: A government agency has 6000 employees.As an
Q86: A customer service center keeps track of
Q87: A recent survey of online shoppers asked
Q88: In listing a property, real estate agencies
Q90: A customer service center keeps track of
Q91: Boxplots of earnings per share (EPS) data
Q92: A customer service center keeps track of
Q93: What scale of measurement is the type
Q94: For families who live in apartments the
Unlock this Answer For Free Now!
View this answer and more for free by performing one of the following actions

Scan the QR code to install the App and get 2 free unlocks

Unlock quizzes for free by uploading documents