Prices per share of the 20 most actively traded stocks on the New York Stock Exchange in October, 2012.A histogram for these data are shown below.The data can be described as ________________________ .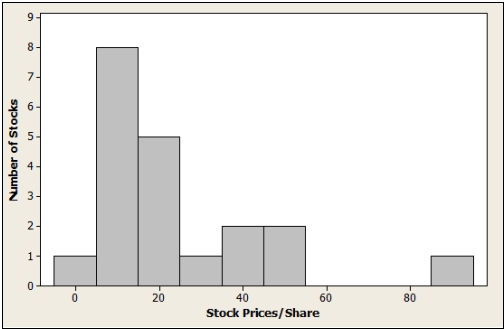
A) the data are skewed to the left with a large positive outlier
B) 5.9 %
C) 17.9 %
D) the data are skewed to the right with a large positive outlier
E) 13.4 %
Correct Answer:
Verified
Q114: A manufacturer of cable wire periodically selects
Q115: A local politician was interested in determining
Q116: Prices per share of the 20 most
Q117: An advocacy group is investigating whether gender
Q118: A magazine that publishes product reviews conducted
Q120: Which is true of the data shown
Q121: A real estate agency, located in a
Q122: A local politician was interested in determining
Q123: A real estate agency, located in a
Q124: Which factor listed below does not affect
Unlock this Answer For Free Now!
View this answer and more for free by performing one of the following actions

Scan the QR code to install the App and get 2 free unlocks

Unlock quizzes for free by uploading documents