Annual estimates of the population in Kauai County, Hawaii from 1999 (t = 1) onward are shown in the time series graph below.The dominant component in this time series is ________________________ .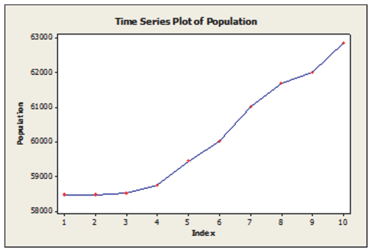
A) cyclicity
B) randomness
C) seasonality
D) trend
E) None of the above.
Correct Answer:
Verified
Q1: Annual estimates of the population in the
Q3: The table below shows the actual closing
Q4: Quarterly sales data (in $10,000) for a
Q5: Annual estimates of the population in Kauai
Q6: The table below shows the actual closing
Q7: Daily closing stock prices for Kyocera Corporation
Q8: American Spinners, a large automobile parts supplier,
Q9: The table below shows the actual closing
Q10: The following table shows actual sales values
Q11: Suppose that the single exponential smoothing (SES)
Unlock this Answer For Free Now!
View this answer and more for free by performing one of the following actions

Scan the QR code to install the App and get 2 free unlocks

Unlock quizzes for free by uploading documents