Quarterly sales data (in $10,000) for a small company specializing in green cleaning products are shown in the time series graph below.The forecasting method that would likely fit these data the best is ________________________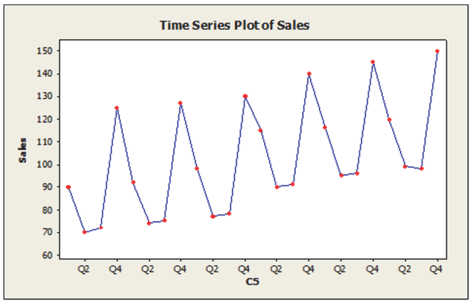
A) single exponential smoothing
B) linear trend
C) seasonal regression model
D) moving average
E) naive
Correct Answer:
Verified
Q1: Annual estimates of the population in the
Q2: Annual estimates of the population in Kauai
Q3: The table below shows the actual closing
Q5: Annual estimates of the population in Kauai
Q6: The table below shows the actual closing
Q7: Daily closing stock prices for Kyocera Corporation
Q8: American Spinners, a large automobile parts supplier,
Q9: The table below shows the actual closing
Q10: The following table shows actual sales values
Q11: Suppose that the single exponential smoothing (SES)
Unlock this Answer For Free Now!
View this answer and more for free by performing one of the following actions

Scan the QR code to install the App and get 2 free unlocks

Unlock quizzes for free by uploading documents