Based on the multiple regression statistics below, how much of the variability in Turnover Rate is explained by this multiple regression model?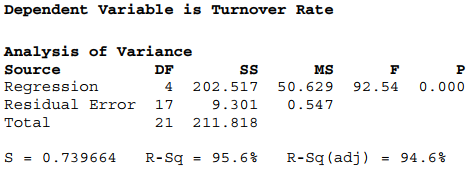
A) 73.9%
B) 95.6%
C) 9.3%
D) 50.62%
E) None of the above.
Correct Answer:
Verified
Q6: Data were collected on the following variables:
Q7: A diagnostic measure used to identify influential
Q8: Data were collected on Job Growth (%)
Q9: A point with a leverage value of
Q10: In a multiple regression model, industry (1=high
Q11: A multiple regression model was fit to
Q12: Below is a scatterplot of size of
Q14: What does the scatterplot below suggest about
Q15: A multiple regression model was fit to
Q16: Data were collected on the following variables:
Unlock this Answer For Free Now!
View this answer and more for free by performing one of the following actions

Scan the QR code to install the App and get 2 free unlocks

Unlock quizzes for free by uploading documents