The scatterplot shows monthly sales figures (in units) and number of months of experience for a sample of salespeople.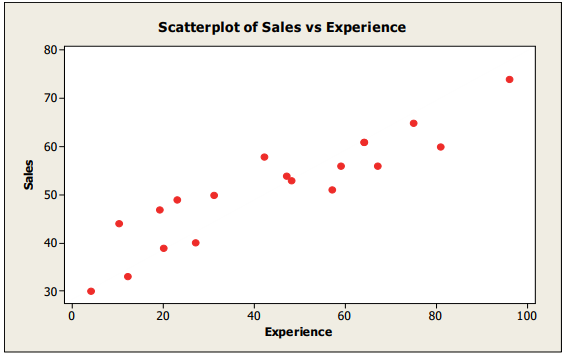
The correlation between monthly sales and level of experience is most ________________________ .
A) -.235
B) 0
C) .180
D) -.914
E) .914
Correct Answer:
Verified
Q2: Suppose the correlation, r, between two variables
Q10: Suppose the correlation, r, between two variables
Q11: For the following scatterplot, Q12: Data were collected on monthly sales revenues Q12: A study examined consumption levels of oil Q13: A small independent organic food store offers Q15: A small independent organic food store offers Q18: The scatterplot shows monthly sales figures (in Q20: A small independent organic food store offers Q21: The disadvantage of re-expressing variables is that![]()
Unlock this Answer For Free Now!
View this answer and more for free by performing one of the following actions

Scan the QR code to install the App and get 2 free unlocks

Unlock quizzes for free by uploading documents