Here is a stacked bar chart for data collected about employee blood pressure.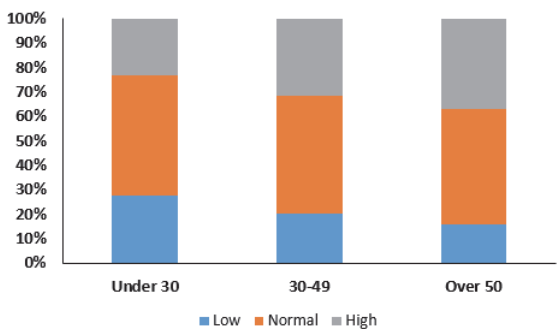
This chart shows _____________________ .
A) the distribution of a quantitative variable
B) the contingency distribution of blood pressure type
C) the conditional distribution of blood pressure type
D) the marginal distribution of blood pressure type
E) the joint distribution of blood pressure type
Correct Answer:
Verified
Q1: A restaurant uses comment cards to get
Q2: A large national retailer of electronics conducted
Q3: A regional survey was carried out to
Q4: The following is a bar chart summarizing
Q6: A regional survey was carried out to
Q7: A automobile marketing firm conducts a study
Q8: A regional survey was carried out to
Q9: A company interested in the health of
Q10: A restaurant uses comment cards to get
Q11: A company interested in the health of
Unlock this Answer For Free Now!
View this answer and more for free by performing one of the following actions

Scan the QR code to install the App and get 2 free unlocks

Unlock quizzes for free by uploading documents