Figure 35-1 
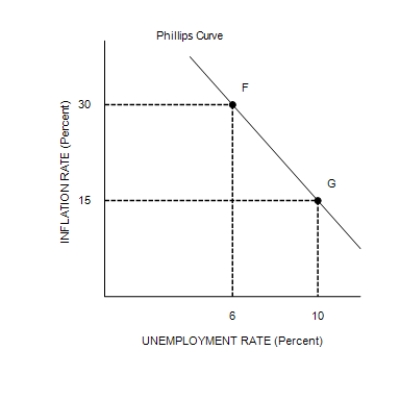
-Refer to Figure 35-1. Suppose points F and G on the right-hand graph represent two possible outcomes for an imaginary economy in the year 2020, and those two points correspond to points B and C, respectively, on the left-hand graph. Also, suppose we know that the price index equaled 120 in 2019. Then the numbers 115 and 130 on the vertical axis of the left-hand graph would have to be replaced by
A) 155 and 175, respectively.
B) 138 and 156, respectively.
C) 137.5 and 154.75, respectively.
D) 135 and 150, respectively.
Correct Answer:
Verified
Q118: Are the effects of an increase in
Q119: Suppose that the Prime Minister and Parliament
Q120: One determinant of the long-run average unemployment
Q121: Suppose that in 2018 and 2019, households
Q122: The government of Blenova considers two policies.
Q124: The short-run Phillips curve shows the combinations
Q125: From 2008-2009 the Federal Reserve created a
Q126: In the long run, policy that changes
Q127: The economy will move to a point
Q128: If policymakers increase aggregate demand, then in
Unlock this Answer For Free Now!
View this answer and more for free by performing one of the following actions

Scan the QR code to install the App and get 2 free unlocks

Unlock quizzes for free by uploading documents