Figure 32-3
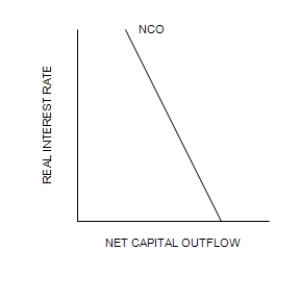
Refer to the following diagram of the open-economy macroeconomic model to answer the questions that follow.
Graph (a)
Graph (b) 
 Graph (c)
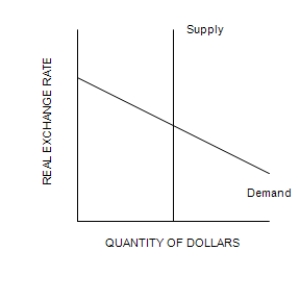
-Refer to Figure 32-3. Which curve shows the relation between the exchange rate and net exports?
A) The demand curve in graph (a) .
B) The demand curve in graph (c) .
C) The supply curve in graph (a) .
D) The supply curve in graph (c) .
Correct Answer:
Verified
Q172: Figure 32-3
Refer to the following diagram of
Q173: Figure 32-5
Refer to the following diagram of
Q174: If the U.S. government went from a
Q175: Figure 32-4
Refer to the following diagram of
Q176: Other things the same, which of the
Q178: Figure 32-3
Refer to the following diagram of
Q179: If the United States raised its tariff
Q180: Figure 32-5
Refer to the following diagram of
Q181: Which of the following accurately describes of
Q182: During the financial crisis it was proposed
Unlock this Answer For Free Now!
View this answer and more for free by performing one of the following actions

Scan the QR code to install the App and get 2 free unlocks

Unlock quizzes for free by uploading documents