Figure 30-2
In the graph, MS represents the money supply and MD represents money demand. The vertical axis is the value of money measured as 1/P and the horizontal axis is the quantity of money. 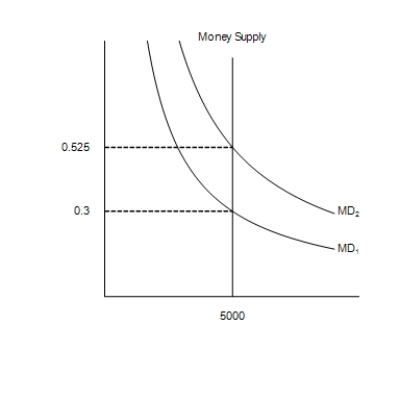
-Refer to Figure 30-2. What quantity is measured along the vertical axis?
A) The price level
B) The real interest rate
C) The value of money
D) The quantity of money
Correct Answer:
Verified
Q140: If the price level increased from 115
Q141: Figure 30-3
On the following graph, MS represents
Q142: Figure 30-2
In the graph, MS represents the
Q143: On a given morning, Franco sold 40
Unlock this Answer For Free Now!
View this answer and more for free by performing one of the following actions

Scan the QR code to install the App and get 2 free unlocks

Unlock quizzes for free by uploading documents