Figure 30-2
In the graph, MS represents the money supply and MD represents money demand. The vertical axis is the value of money measured as 1/P and the horizontal axis is the quantity of money. 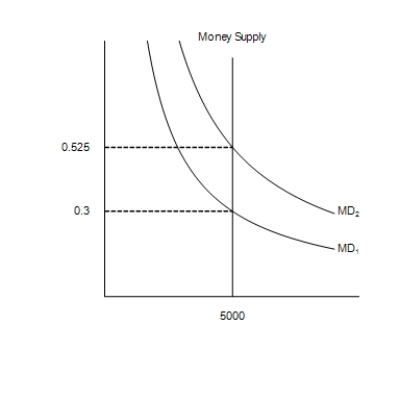
-Refer to Figure 30-2. Suppose the relevant money-demand curve is the one labeled MD2; also suppose the velocity of money is 2. If the money market is in equilibrium, then the economy's real GDP amounts to
A) 4,761.9.
B) 9,523.8.
C) 5,250.0.
D) 10,000.0.
Correct Answer:
Verified
Q143: On a given morning, Franco sold 40
Q144: Figure 30-1 Q145: Figure 30-2 Q146: An associate professor of physics gets a Q147: Last year, you earned a nominal wage Q149: Figure 30-3 Q150: Last year, Jane spent all of her Q151: When the market for money is drawn Q152: The price level is a Q153: Figure 30-3![]()
In the graph, MS represents the
On the following graph, MS represents
A)relative variable.
B)dichotomous variable
C)real
On the following graph, MS represents
Unlock this Answer For Free Now!
View this answer and more for free by performing one of the following actions

Scan the QR code to install the App and get 2 free unlocks

Unlock quizzes for free by uploading documents