Figure 30-3
On the following graph, MS represents the money supply and MD represents money demand. 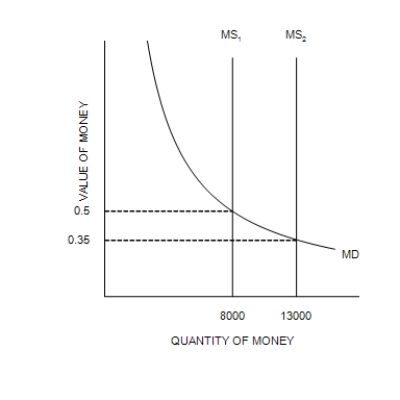
-Refer to Figure 30-3. Suppose the relevant money-supply curve is the one labeled MS2; also suppose the economy's real GDP is 65,000 for the year. If the market for money is in equilibrium, then the velocity of money is approximately
A) 2.0.
B) 14.3.
C) 2.9.
D) 0.35.
Correct Answer:
Verified
Q148: Figure 30-2
In the graph, MS represents the
Q149: Figure 30-3
On the following graph, MS represents
Q150: Last year, Jane spent all of her
Q151: When the market for money is drawn
Q152: The price level is a
A)relative variable.
B)dichotomous variable
C)real
Q154: In the 1970s, in response to recessions
Unlock this Answer For Free Now!
View this answer and more for free by performing one of the following actions

Scan the QR code to install the App and get 2 free unlocks

Unlock quizzes for free by uploading documents