Figure 30-3
On the following graph, MS represents the money supply and MD represents money demand. 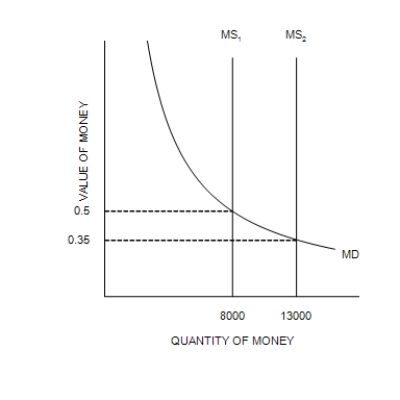
-Refer to Figure 30-3. Which of the following events could explain a shift of the money-supply curve from MS2 to MS1?
A) A decrease in the value of money
B) An increase in the price level
C) An open-market sale of bonds by the Federal Reserve
D) The Federal Reserve buys bonds
Correct Answer:
Verified
Q136: Suppose that velocity and output are constant
Q137: Suppose the market for money, drawn with
Q138: When prices are falling, economists say that
Q139: When the market for money is drawn
Q140: If the price level increased from 115
Q142: Figure 30-2
In the graph, MS represents the
Q143: On a given morning, Franco sold 40
Unlock this Answer For Free Now!
View this answer and more for free by performing one of the following actions

Scan the QR code to install the App and get 2 free unlocks

Unlock quizzes for free by uploading documents