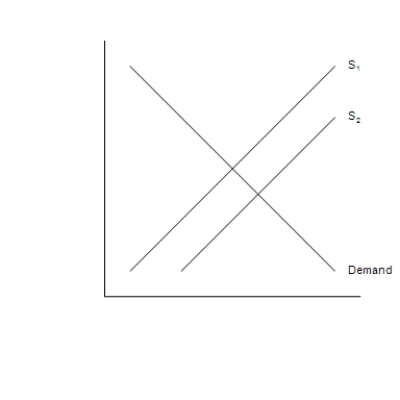
Figure 26-1 The Figure Depicts a Demand-For-Loanable-Funds Curve and Two Supply-Of-Loanable-Funds Curves
Figure 26-1
The figure depicts a demand-for-loanable-funds curve and two supply-of-loanable-funds curves. 
-Refer to Figure 26-1. What is measured along the vertical axis of the graph?
A) The tax rate
B) The interest rate
C) The quantity of investment
D) The quantity of saving
Correct Answer:
Verified
Q207: Suppose the government changed the tax laws,
Q208: If we were to change the interpretation
Q209: Crowding out occurs when investment declines because
Q210: Which of the following would necessarily create
Q211: Figure 26-2
The figure depicts a supply-of-loanable-funds curve
Q213: If the government instituted an investment tax
Q214: Which of the following counts as part
Q215: In 2002 mortgage rates fell and mortgage
Q216: Figure 26-2
The figure depicts a supply-of-loanable-funds curve
Q217: If the nominal interest rate is 8
Unlock this Answer For Free Now!
View this answer and more for free by performing one of the following actions

Scan the QR code to install the App and get 2 free unlocks

Unlock quizzes for free by uploading documents