Figure 26-1 The Figure Depicts a Demand-For-Loanable-Funds Curve and Two Supply-Of-Loanable-Funds Curves
Figure 26-1
The figure depicts a demand-for-loanable-funds curve and two supply-of-loanable-funds curves. 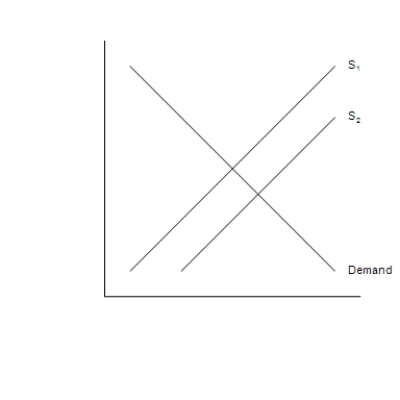
-Refer to Figure 26-1. Which of the following events would shift the supply curve from S1 to S2?
A) In response to tax reform, firms are encouraged to invest more than they previously invested.
B) In response to tax reform, households are encouraged to save more than they previously saved.
C) Government goes from running a balanced budget to running a budget deficit.
D) Any of the above events would shift the supply curve from S1 to S2.
Correct Answer:
Verified
Q199: The slope of the demand for loanable
Q200: In a closed economy, public saving is
Q201: A budget deficit
A)changes the supply of loanable
Q202: Which of the following could explain an
Q203: Suppose a country has only a sales
Q205: Suppose the U.S. offered a tax credit
Q206: What would happen, all else equal, in
Q207: Suppose the government changed the tax laws,
Q208: If we were to change the interpretation
Q209: Crowding out occurs when investment declines because
Unlock this Answer For Free Now!
View this answer and more for free by performing one of the following actions

Scan the QR code to install the App and get 2 free unlocks

Unlock quizzes for free by uploading documents