Figure 26-3 The Figure Shows Two Demand-For-Loanable-Funds Curves and Two Supply-Of-Loanable-Funds Curves
Figure 26-3
The figure shows two demand-for-loanable-funds curves and two supply-of-loanable-funds curves.
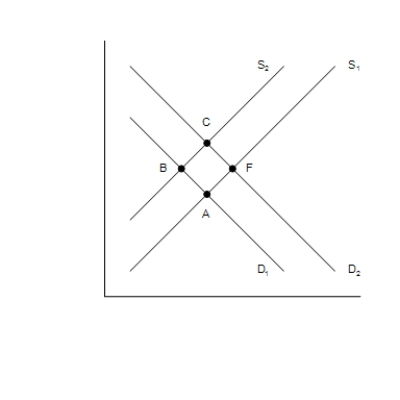
-Refer to Figure 26-3. A shift of the demand curve from D1 to D2 is called
A) a decrease in the quantity of loanable funds demanded.
B) an increase in the demand for loanable funds.
C) an increase in the quantity of loanable funds demanded.
D) a decrease in the demand for loanable funds.
Correct Answer:
Verified
Q214: Which of the following counts as part
Q215: In 2002 mortgage rates fell and mortgage
Q216: Figure 26-2
The figure depicts a supply-of-loanable-funds curve
Q217: If the nominal interest rate is 8
Q218: If the demand for loanable funds shifts
Q220: A larger budget deficit
A)raises the interest rate
Q221: Figure 26-3
The figure shows two demand-for-loanable-funds curves
Q222: Figure 26-4
This figure shows the loanable funds
Q223: Figure 26-3
The figure shows two demand-for-loanable-funds curves
Q224: Figure 26-4
This figure shows the loanable funds
Unlock this Answer For Free Now!
View this answer and more for free by performing one of the following actions

Scan the QR code to install the App and get 2 free unlocks

Unlock quizzes for free by uploading documents