Figure 18-8
The figure shows the relationship between the number of mechanics hired and the number of car repairs performed per day at a car-repair shop.
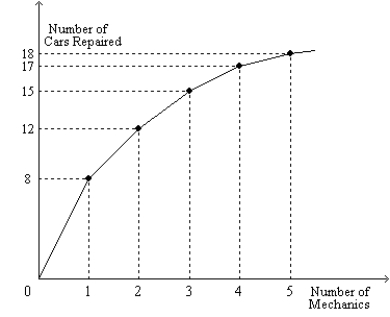
-Refer to Figure 18-8. The relationship depicted on the graph is called a _______ function.
Correct Answer:
Verified
Q82: Figure 18-8
The figure shows the relationship between
Q83: What is the relationship between the marginal
Q84: When a competitive firm hires labor up
Q85: Jen's wage decreased, and she responded by
Q86: Figure 18-8
The figure shows the relationship between
Q88: Figure 18-8
The figure shows the relationship between
Q89: A competitive, profit-maximizing pays its workers a
Q90: Figure 18-8
The figure shows the relationship between
Q91: Does history suggest that most technological progress
Q92: The substantial increases in output per worker
Unlock this Answer For Free Now!
View this answer and more for free by performing one of the following actions

Scan the QR code to install the App and get 2 free unlocks

Unlock quizzes for free by uploading documents