Figure 18-6 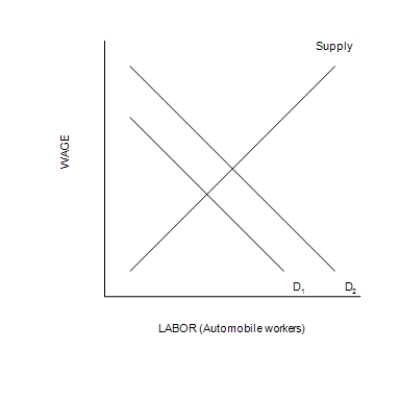
-Refer to Figure 18-6. Which of the following is a possible explanation of the shift of the labor demand curve from D1 to D2?
A) The wage earned by automobile workers increased.
B) The price of automobiles increased.
C) The opportunity cost of leisure, as perceived by automobile workers, decreased.
D) Large segments of the population changed their tastes regarding leisure versus work.
Correct Answer:
Verified
Q213: Consider the market for capital equipment. Suppose
Q214: Scenario 18-6
Suppose the following events occur in
Q215: Suppose that a violent earthquake causes the
Q216: The wage is to the labor market
Q217: If one were to consider a university
Unlock this Answer For Free Now!
View this answer and more for free by performing one of the following actions

Scan the QR code to install the App and get 2 free unlocks

Unlock quizzes for free by uploading documents