Multiple Choice
Figure 16-5
The figure is drawn for a monopolistically competitive firm. 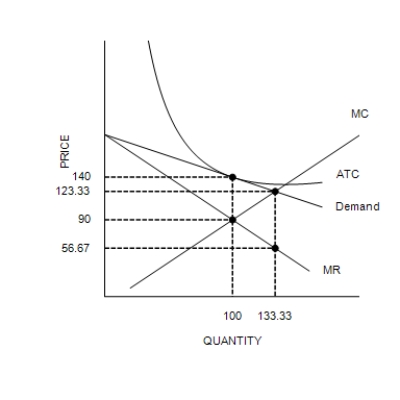
-Refer to Figure 16-5. The quantity of output at which the MC and ATC curves cross is the
A) efficient scale of the firm.
B) short-run equilibrium quantity of output for the firm.
C) long-run equilibrium quantity of output for the firm.
D) profit-maximizing quantity.
Correct Answer:
Verified
Related Questions
Q181: Figure 16-5
The figure is drawn for a
Q182: Figure 16-5
The figure is drawn for a

