Figure 14-3
Suppose a firm operating in a competitive market has the following cost curves: 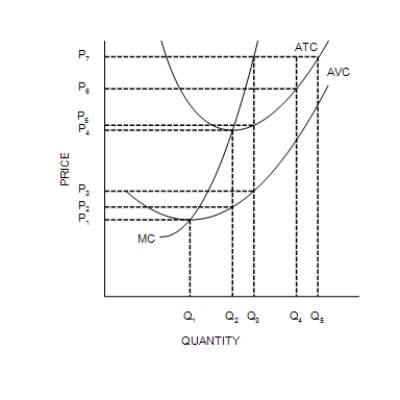
-Refer to Figure 14-3. When market price is P2, a profit-maximizing firm's losses can be represented by the area
A) (P4 − P2) × Q2.
B) (P2 − P1) × (Q2 − Q1) .
C) At a market price of P2, the firm earns profits, not losses.
D) At a market price of P2 the firm has losses, but the reference points in the figure don't identify the losses.
Correct Answer:
Verified
Q212: A firm that shuts down temporarily has
Q213: Figure 14-3
Suppose a firm operating in a
Q214: Figure 14-1
Suppose that a firm in a
Q215: Figure 14-2
Suppose a firm operating in a
Q216: Figure 14-3
Suppose a firm operating in a
Q218: Figure 14-2
Suppose a firm operating in a
Q219: Figure 14-1
Suppose that a firm in a
Q220: Figure 14-1
Suppose that a firm in a
Q221: The competitive firm's long-run supply curve is
Q222: A competitive market is in long-run equilibrium.
Unlock this Answer For Free Now!
View this answer and more for free by performing one of the following actions

Scan the QR code to install the App and get 2 free unlocks

Unlock quizzes for free by uploading documents