Figure 14-4
In the following figure, graph (a) depicts the linear marginal cost (MC) of a firm in a competitive market, and graph (b) depicts the linear market supply curve for a market with a fixed number of identical firms.
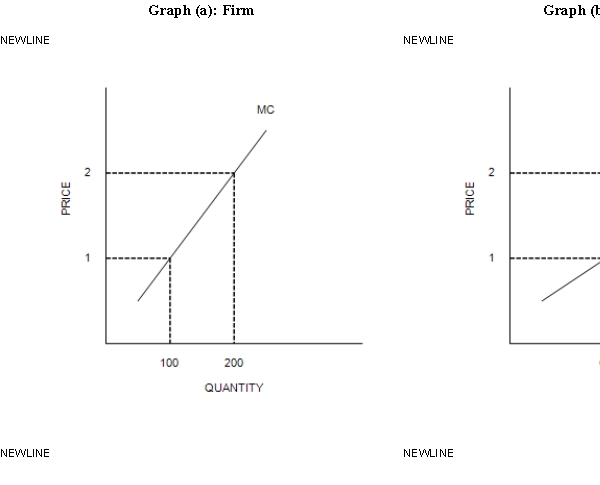
-Refer to Figure 14-4. If there are 300 identical firms in this market, what level of output will be supplied to the market when price is $1.00?
A) 300
B) 6,000
C) 30,000
D) 60,000
Correct Answer:
Verified
Q233: If there is an increase in market
Q234: Figure 14-4
In the following figure, graph (a)
Q235: When some resources used in production are
Q236: Scenario 14-3
Victor is the recipient of $1
Q237: When new firms enter a perfectly competitive
Q239: Consider a competitive market with a large
Q240: Which of the following represents the firm's

