Multiple Choice
Figure 14-4
In the following figure, graph (a) depicts the linear marginal cost (MC) of a firm in a competitive market, and graph (b) depicts the linear market supply curve for a market with a fixed number of identical firms.
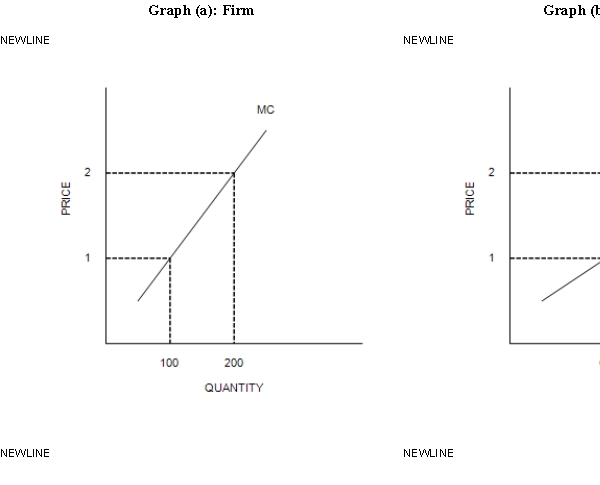
-Refer to Figure 14-4. If there are 100 identical firms in this market, what is the value of Q2?
A) 10,000
B) 20,000
C) 40,000
D) 80,000
Correct Answer:
Verified
Related Questions

