Multiple Choice
Figure 13-1 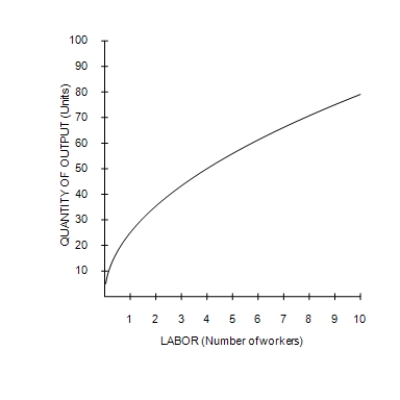
-Refer to Figure 13-1. The graph illustrates a typical
A) total-cost curve.
B) production function.
C) production possibilities frontier.
D) marginal product of labor curve.
Correct Answer:
Verified
Related Questions
Q175: Suppose a certain firm is able to
Q176: Scenario 13-3
Diamond is an organic brocolli farmer,
Q177: Scenario 13-3
Diamond is an organic brocolli farmer,
Unlock this Answer For Free Now!
View this answer and more for free by performing one of the following actions

Scan the QR code to install the App and get 2 free unlocks

Unlock quizzes for free by uploading documents