Figure 13-4
Figure 1
Figure 2
Figure 3
Figure 4 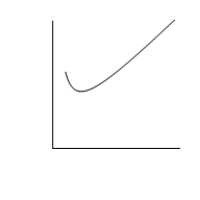
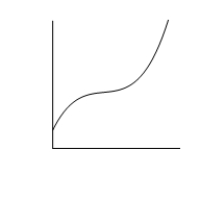
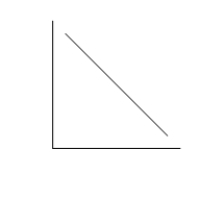
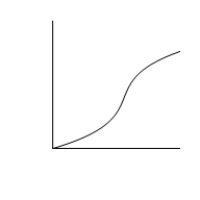
-Refer to Figure 13-4. Which of the figures represents the total cost curve for a typical firm?
A) Figure 1
B) Figure 2
C) Figure 3
D) Figure 4
Correct Answer:
Verified
Q231: Average total cost is increasing whenever
A)total cost
Q232: When a factory is operating in the
Q233: When marginal cost is less than average
Q234: A firm that produces and sells furniture
Q235: Figure 13-2 Q237: In the short run, a firm that Q238: Figure 13-3 Q239: The minimum points of the average variable Q240: Figure 13-3 Q241: Unlock this Answer For Free Now! View this answer and more for free by performing one of the following actions Scan the QR code to install the App and get 2 free unlocks Unlock quizzes for free by uploading documents![]()
![]()
![]()
![]()

