Figure 10-1 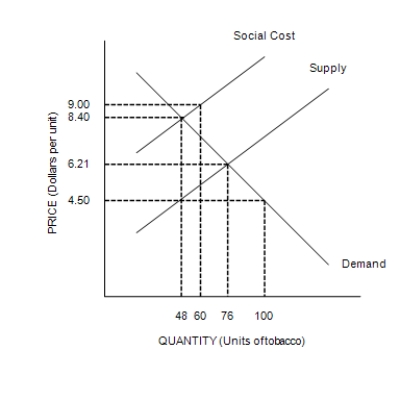
-Refer to Figure 10-1. This graph represents the tobacco industry. The socially optimal price and quantity are
A) $9.00 and 60 units, respectively.
B) $8.40 and 48 units, respectively.
C) $6.21 and 76 units, respectively.
D) $4.50 and 100 units, respectively.
Correct Answer:
Verified
Q135: Suppose that coal producers create a negative
Q136: Figure 10-2 Q137: Figure 10-2 Q138: Figure 10-2 Q139: Figure 10-3 Q141: Suppose that cookie producers create a positive Q142: Which of the following is an example Q143: Figure 10-4 Q144: Which of the following is NOT a Q145: Figure 10-3 Unlock this Answer For Free Now! View this answer and more for free by performing one of the following actions Scan the QR code to install the App and get 2 free unlocks Unlock quizzes for free by uploading documents![]()
![]()
![]()
![]()
![]()
![]()

