Multiple Choice
Figure 10-5 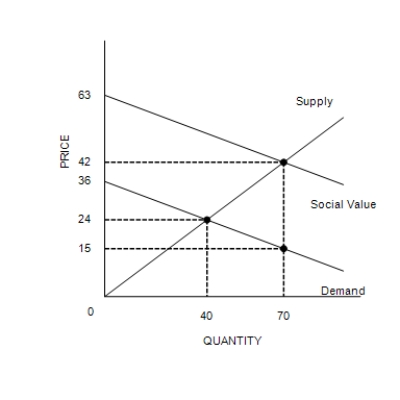
-Refer to Figure 10-5. The graph represents a market in which
A) there is no externality.
B) there is a positive externality.
C) there is a negative externality.
D) The answer cannot be determined from inspection of the graph.
Correct Answer:
Verified
Related Questions
Q172: Figure 10-6 Q173: Scenario 10-1 Q174: Figure 10-4 Q175: Figure 10-5 Q176: Scenario 10-1
![]()
The demand curve for gasoline slopes
![]()
![]()
The demand curve for gasoline slopes

