Figure 9-7
The following diagram shows the domestic demand and domestic supply curves in a market. 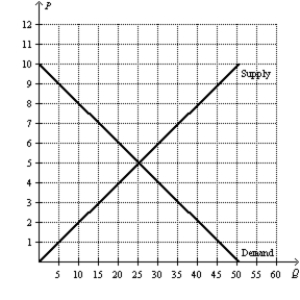
-Refer to Figure 9-7. Suppose the world price in this market is $7. If the country allows free trade, by how much do consumer surplus, producer surplus, and total surplus change with trade?
Correct Answer:
Verified
View Answer
Unlock this answer now
Get Access to more Verified Answers free of charge
Q90: Figure 9-8
The following diagram shows the domestic
Q91: Figure 9-8
The following diagram shows the domestic
Q92: Figure 9-8
The following diagram shows the domestic
Q93: Figure 9-7
The following diagram shows the domestic
Q94: Figure 9-9
The following diagram shows the domestic
Q96: Scenario 9-2
Suppose domestic demand and domestic
Q97: Scenario 9-2
Suppose domestic demand and domestic
Q98: Scenario 9-2
Suppose domestic demand and domestic
Q99: Scenario 9-2
Suppose domestic demand and domestic
Q100: Scenario 9-2
Suppose domestic demand and domestic
Unlock this Answer For Free Now!
View this answer and more for free by performing one of the following actions

Scan the QR code to install the App and get 2 free unlocks

Unlock quizzes for free by uploading documents