Figure 9-9
The following diagram shows the domestic demand and domestic supply curves in a market. 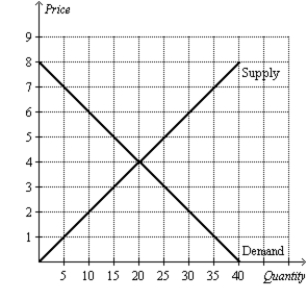
-Refer to Figure 9-9. Suppose the world price in this market is $6. If the country allows free trade, how much is consumer surplus?
Correct Answer:
Verified
View Answer
Unlock this answer now
Get Access to more Verified Answers free of charge
Q106: Figure 9-10
The following diagram shows the domestic
Q107: Figure 9-9
The following diagram shows the domestic
Q108: Figure 9-10
The following diagram shows the domestic
Q109: Figure 9-10
The following diagram shows the domestic
Q110: Figure 9-10
The following diagram shows the domestic
Q112: List five arguments given to support trade
Q113: How does an import quota differ from
Q114: Characterize the two different approaches a nation
Q115: Figure 9-10
The following diagram shows the domestic
Q116: Figure 9-10
The following diagram shows the domestic
Unlock this Answer For Free Now!
View this answer and more for free by performing one of the following actions

Scan the QR code to install the App and get 2 free unlocks

Unlock quizzes for free by uploading documents