Figure 9-10
The following diagram shows the domestic demand and domestic supply curves in a market. Assume that the world price in this market is $1 per unit. 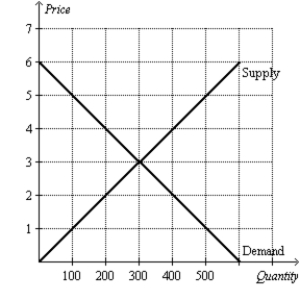
-Refer to Figure 9-10. Suppose the country imposes a $1 per unit tariff. If the country allows trade with a tariff, how much is total surplus?
Correct Answer:
Verified
View Answer
Unlock this answer now
Get Access to more Verified Answers free of charge
Q112: List five arguments given to support trade
Q113: How does an import quota differ from
Q114: Characterize the two different approaches a nation
Q115: Figure 9-10
The following diagram shows the domestic
Q116: Figure 9-10
The following diagram shows the domestic
Q118: Figure 9-10
The following diagram shows the domestic
Q119: Figure 9-10
The following diagram shows the domestic
Q120: Figure 9-9
The following diagram shows the domestic
Q121: Figure 9-1 Q122: What are the arguments in favor of
Uganda![]()
Unlock this Answer For Free Now!
View this answer and more for free by performing one of the following actions

Scan the QR code to install the App and get 2 free unlocks

Unlock quizzes for free by uploading documents