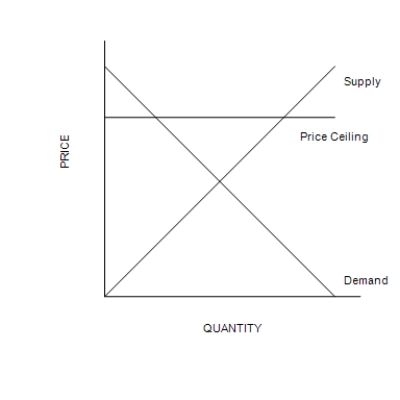
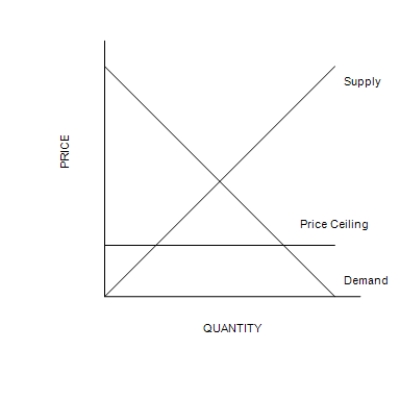
Figure 6-1
Graph (a)
Graph (b)


-Refer to Figure 6-1. A binding price ceiling is shown in
A) graph (a) only.
B) graph (b) only.
C) both graph (a) and graph (b) .
D) neither graph (a) nor graph (b) .
Correct Answer:
Verified
Q225: If a nonbinding price floor is imposed
Q226: If a price floor is not binding,
Q227: A surplus results when a
A)nonbinding price floor
Q228: A price ceiling is
A)often imposed on markets
Q229: Suppose the government wants to encourage Americans
Q231: The presence of a price control in
Q232: Suppose the equilibrium price of a physical
Q233: If a price ceiling is binding, then
A)there
Q234: If the government imposes a binding price
Q235: A price floor is
A)a legal maximum on
Unlock this Answer For Free Now!
View this answer and more for free by performing one of the following actions

Scan the QR code to install the App and get 2 free unlocks

Unlock quizzes for free by uploading documents