Multiple Choice
Figure 6-4
Graph (a)
Graph (b)
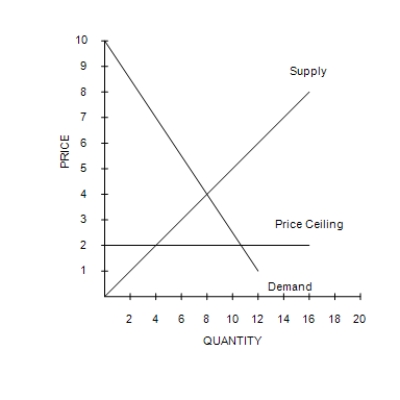
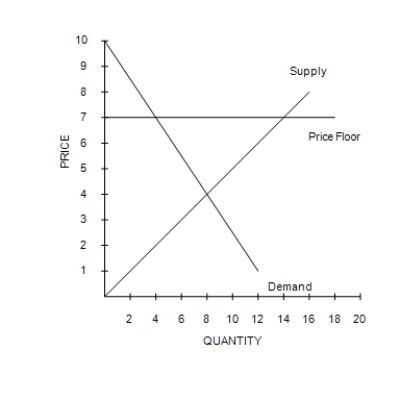
-Refer to Figure 6-4. In graph (b) , there will be
A) a shortage.
B) equilibrium in the market.
C) a surplus.
D) lines of people waiting to buy the good.
Correct Answer:
Verified
Related Questions
Q250: Figure 6-6 Q251: Consider the market for gasoline. Buyers Q252: Figure 6-3 Q253: Figure 6-8 Q254: Table 6-1 Q256: Figure 6-9 Q257: Suppose the equilibrium price of a stick Q258: Table 6-1 Q259: In the 1970s, long lines at gas Q260: Figure 6-7 Unlock this Answer For Free Now! View this answer and more for free by performing one of the following actions Scan the QR code to install the App and get 2 free unlocks Unlock quizzes for free by uploading documents
![]()
A)and sellers
![]()
![]()
The following table contains the
![]()
The following table contains the
![]()

