Figure 4-1 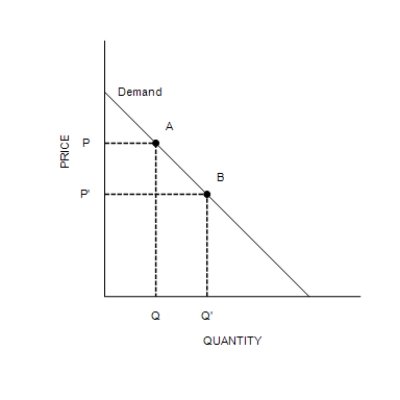
-Refer to Figure 4-1. The movement from point A to point B on the graph shows
A) a decrease in demand.
B) an increase in demand.
C) a decrease in quantity demanded.
D) an increase in quantity demanded.
Correct Answer:
Verified
Q168: The market demand curve
A)shows how quantity demanded
Q169: Figure 4-1 Q170: Figure 4-2 Q171: A monopoly is a market with one Q172: Table 4-1 Q174: The quantity demanded of a good is Q175: The line that relates the price of Q176: A decrease in the price of a Q177: Figure 4-1 Q178: The law of demand states that, other Unlock this Answer For Free Now! View this answer and more for free by performing one of the following actions Scan the QR code to install the App and get 2 free unlocks Unlock quizzes for free by uploading documents![]()
Consumer 1
Consumer 2 ![]()
A)seller,
![]()

