Multiple Choice
Figure 4-1 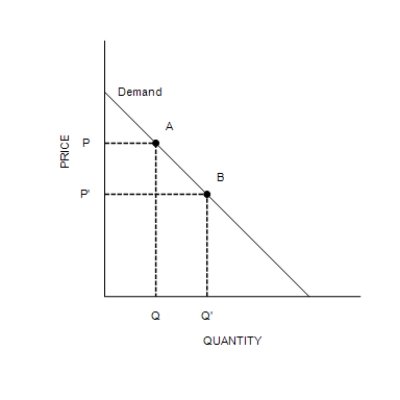
-Refer to Figure 4-1. The movement from point A to point B on the graph is caused by
A) an increase in price.
B) a decrease in price.
C) a decrease in the price of a substitute good.
D) an increase in income.
Correct Answer:
Verified
Related Questions
Q164: Which of the following is not held
Q165: Which of the following demonstrates the law
Q166: Suppose that when the price of a
Q167: A demand schedule is a table that
Q168: The market demand curve
A)shows how quantity demanded

